|
Is e Normal? |
|
|
|
A number is called "normal" with respect to a given base if, when the number is expressed in that base, the asymptotic frequencies of occurrence of each distinct string of k digits are equal, and this applies to every positive integer k. For example, if a number is normal in the base 10, the asymptotic frequency of occurrence of each of the decimal numerals 0, 1, …, 9 is precisely 1/10, and the asymptotic frequency of each two-digit strings 00, 01, 02, ..., 99 is exactly 1/100, and so on. By the same token, the asymptotic frequency of occurrence of each 10-digit string must be exactly 1/1010. Now, of the distinct 10-digit strings, exactly 10! contain each numeral just once, i.e., there are 10! permutations of the 10 decimal numerals 0, 1, ..., 9. Therefore, if a number is normal in the base 10, the asymptotic frequency of 10-digit strings comprising permutations of all 10 numerals must be 10!/1010, which equals roughly 1/2755.73. |
|
|
|
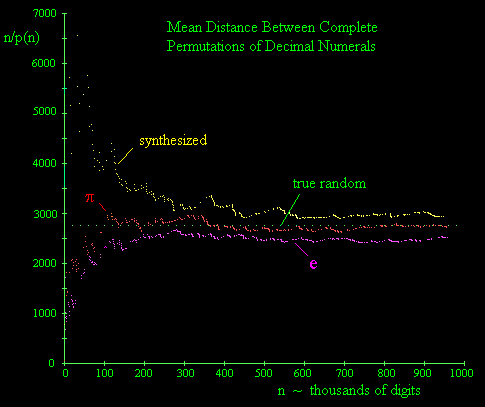
It’s widely believed that the two most naturally occurring transcendental numbers, π and e, are both normal in the base 10 (although it has never even been proven that the individual numerals of these numbers have equal asymptotic frequencies), and indeed if we examine the occurrences of complete permutation strings in the first million digits of π we find very good agreement with the expected frequency, i.e., if p(n) denotes the numbers of complete permutation strings in the first n digits, then n/p(n) apparently converges on 2755, and it does so fairly rapidly. However, somewhat surprisingly, if we examine the first million decimal digits of the number e, we find that the ratio n/p(n) seems to settle at a value around 2520, as shown in the figure below. |
|
|
|
|
|
|
|
This result is confirmed by continuing to check the next million digits, which show no very significant upward trend in this ratio, leaving it at 2568. (See the note on The e in Petersburg for a plot covering the first two million digits.) Hence the frequency of complete permutation strings is more than 6% greater than what would be predicted for a "normal" number. This suggestion of non-normality seems quite implausible, so I checked digits of e computed independently by two different sources, but in both cases the results were identical. Also, the fact that the digits of π yield the expected frequency using my counting program tends to support the validity of the program - which, after all, is just a simple counting routine. Could there be some systematic error in this assessment? |
|
|
|
To provide another check of these results I acquired a set of 1 million pseudo-random digits generated by the Rand Corporation in 1955 based on work begun in 1947. According to the documentation accompanying these digits, the basic table was produced during May and June of 1947 by means of an "electronic roulette wheel". This device consisted of a random frequency pulse source, providing on the average about 100,000 pulses per second, gated about once per second by a constant frequency pulse. The pulses were then passed through a 5-place binary counter. There were about 3000 revolutions per "trial", leading to the output of one number per second. A binary-to-decimal converter was then used to convert 20 of the 32 numbers (the other twelve were discarded), and it retained only the final digit of two-digit numbers. Interestingly, the documentation notes that "production from the original machine showed statistically significant biases, and the engineers had to make several modifications and refinements of the circuits before production of apparently satisfactory numbers was achieved". Even after these modifications, some statistical biases remained. The final step in producing the table of "random digits" was to transform the table by adding pairs of digits modulo 10. This was done "in order to improve the distribution of the digits". There were 20,000 punched cards with 50 digits per card; each digit on a given card was added modulo 10 to the corresponding digit of the preceding card to yield a re-randomized digit. It is this transformed table which is published..." |
|
|
|
This is an interesting "re-randomization" technique, since it represents something like a convolution of the data sequence. In other words, if the string of digits is in an array D[i] of length 1 million, the process consisted of applying the transformation |
|
|
|
|
|
|
|
Presumably for completeness we would stipulate that the digits "wrap around", e.g., D'[1] would equal the sum of D[1] and D[999951]. Iterations of this transformation don't seem to degenerate into an orderly sequence, given a sufficiently disordered initial sequence. |
|
|
|
In any case, results for the Rand sequence are also plotted on the figure above, labeled as "synthesized". This sequence behaves very differently than the digits of π or e. It starts out quite high, meaning that there is a scarcity of complete permutation sequences. Eventually it settles down in the vicinity of the theoretical value, but it seems to converge on a slightly higher value. Is there a systematic bias in the Rand data, or does it simply require far more digits to establish the asymptotic density of complete permutation sequences? |
|
|
|
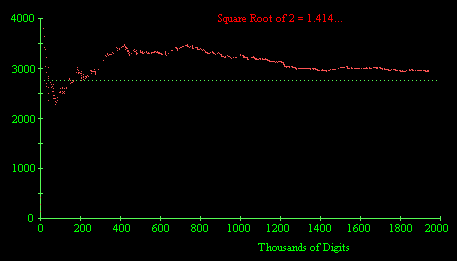
To study this further, I acquired the first two million decimal digits of the square root of 2, as computed by Nemiroff & Bonnell. The rate of occurrence of complete permutation strings is shown in the figure below. |
|
|
|
|
|
|
|
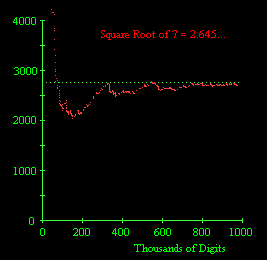
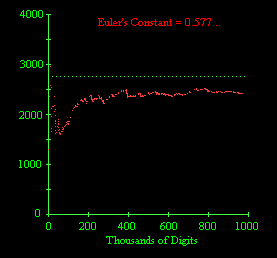
This seems to show a systematic upward bias, i.e., a scarcity of complete permutation strings relative to the expected frequency based on the assumption of normality. I also acquired the first million decimal digits of the square root of 7, and of Euler's constant g = 0.577... The behaviors of n/p(n) for the digits of these two numbers are shown below. |
|
|
|
|
|
|
|
The digits of the square root of 7 seem to converge fairly well on the predicted frequency, but the digits of gamma seem to be consistently richer in complete permutations, i.e., n/p(n) is low, at least out to one million digits. |
|
|
|
It may be worth noting that of all these numbers, the digits of π are the most thoroughly checked and verified, and those are the digits that converge most satisfactorily to the theoretical value. For the digits of the other constants (e, γ, √2, √7), Nemiroff & Bonnell are careful to point out that they do not guarantee their accuracy, and they invite other people to check them. |
|
|
|
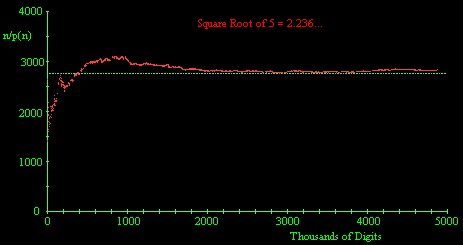
For another check, I acquired the first five million decimal digits of the square root of 5 as computed by Dawson Merrill. He has actually computed 10 million digits, but says only the first five million have been checked, and he is confident of their correctness. The average interval between complete permutation strings, plotted below, seems to converge fairly well on the predicted theoretical value. |
|
|
|
|
|
|
|
These mixed results lead to the question of how many digits would need to be checked in order to reasonably expect the overall frequency of complete permutation strings to be within, say, 1% of the theoretical asymptotic value. Also, does the speed of convergence for the digits of a particular number have any significance? Is the prompt convergence for the decimal digits of π on the asymptotic value just an accident? |
|
|
|
One possible way of trying to answer these questions would be to treat the occurrence of Complete Permutation Strings (CPSs) as a Poisson process. Of course, since the digits of overlapping strings are not independent, this isn't exactly correct, because a Poisson model assumes a memoryless process, i.e., it assumes that the expected distance to the next occurrence is independent of any prior occurrences. With CPSs this is not the case, because the string immediately following a CPS has a probability of about 1/10 of also being a CPS (since the new digit simply needs to equal the digit being discarded). This is roughly born out in the case of the digits of e, because of the 778 CPSs there are 67 cases of consecutive CPSs. There are also 6 cases of two CPSs at a distance of 2 digits. On the other hand, it's also true that non-CPSs are disproportionately likely to have non-CPS neighbors, because pairs of duplicate digits are likely to be contained in the overlap of neighboring strings. |
|
|
|
Nevertheless, we can use the Poisson model to give a rough estimate of the probability that the observed frequency over a given interval differs from the asymptotic frequency by various amounts. As discussed in Poisson Processes and Queues, the probability of exactly k occurrences of an (exponentially distributed) event with rate L in time (or number of trials) T is |
|
|
|
|
|
|
|
For large k we can use Stirling's formula for k! to write this in the more easily computed form |
|
|
|
|
|
|
|
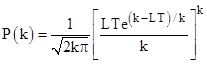
We examined the first T = 2,000,000 strings in the decimal expansion of e, and found k = 778 complete permutation strings. The theoretical rate is L = 1/2755.73, so the expected number of CPSs in this range is LT = 725.76. The probability of finding exactly k complete strings in the first 2 million decimal digits is shown below for k ranging from 600 to 900. |
|
|
|
|
|
|
|
We've also marked on this figure the value 778, which is the number of CPSs found in the first 2,000,000 decimal digits of e. The probability that k would be equal to or greater than 778 is only about 2.8% based on this Poisson model. |
|
|
|
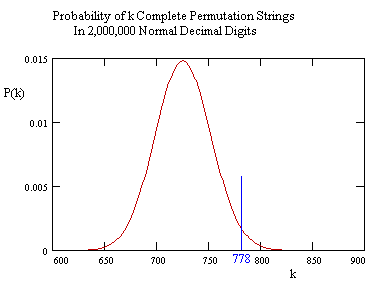
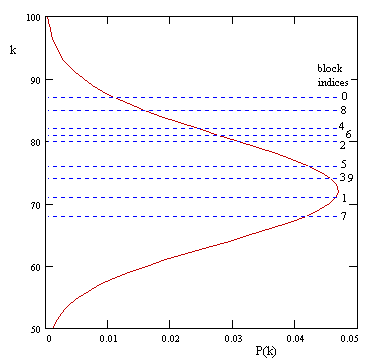
A better method of evaluation would be to examine the digits in disjoint blocks of 10, because these blocks would (presumably) be statistically independent. On this basis our 2 million digits of e represent only 200,000 independent samples, among which we would expect to find 72.57 complete permutation strings. Now, we can split up the digits in essentially 10 different ways, depending on how we choose to frame the blocks. This amounts to partitioning the 778 CPSs according to the least significant digit of their index. Doing this, we find the following results |
|
|
|
|
|
|
|
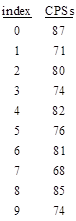
On this basis the Poisson model is actually valid, so we can plot these results on top of the predicted distribution as shown below. |
|
|
|
|
|
|
|
The average of our ten "samples" is 77.8 (although these samples are not independent), and we can compute that the probability of this being 78 or higher is about 27.8%. Hence it is not terribly improbable that we would find this deviation from the expected number of CPSs over this number of digits. It would evidently be necessary to examine about 20 million digits to give a valid basis for drawing a conclusion about the actual density of CPSs in the decimal digits of e. |
|
|
|
It's interesting that the block indices seem to bifurcate into the odds and the evens. In fact, if we just focused on the odd blocks, we find a mean of 72.6 CPSs per 200,000 samples, in excellent agreement with the expected number (72.57). In contrast, the even-indexed blocks have an average of 83 CPSs per 200,000 samples. The probability of finding 83 or more CPSs in this range is only 12.3%. |
|
|
|
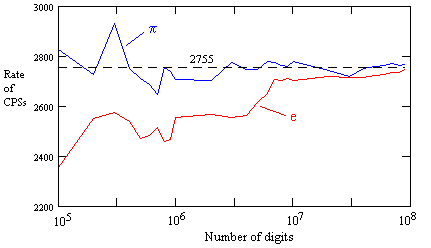
Postscript: In November 2013 I received an email from Dan Corson informing me that, using digits of e computed by a program called “y-cruncher”, he had checked the number of CPSs up to 100 million digits, and found that it does finally approach the expected value, although even by this point it has not quite ever reached the expected value. Below is a plot of the rate of CPSs versus the number of digits for both e and π, based on tabulations provided by Corson (at ten samples per decade). |
|
|
|
|
|
|
|
Our previous considerations indicated that “it would evidently be necessary to examine about 20 million digits to give a valid basis for drawing a conclusion about the actual density of CPSs in the decimal digits of e”. This seems to be at least partially confirmed by the data, since by 20 million digits the observed rate is about 2720, which is significantly closer to the predicted asymptote than the observed rate in the first 2 million digits (which, we recall, was only about 2568). The most abrupt rise occurs between 4 million and 7 million digits, during which the rate rises from 2563 to 2707. It's somewhat re-assuring that the rate does eventually approach the predicted asymptote, but nevertheless it’s still interesting that it stays low for so long, especially in comparison with how quickly the digits of some other irrational numbers (such as π) approach the long-term expectation. Is it conceivable that different irrational numbers have different "frequencies", such that high-frequency numbers exhibit their expected averages very quickly, whereas low-frequency numbers may require billions of digits to exhibit the expected averages? |
|
|