|
Normalized Average Probability |
|
|
|
Paragraph 6a of the Arsenal draft Advisory Circular (AC) 25.1309 [Note 1] summarized the original intent of the quantitative risk criteria, which was to require that the probability of a given system failure leading to a catastrophic accident in 10 million flight hours be less than 1/100 [Note 2]. Therefore, letting Pave denote the average per-flight probability of a catastrophic accident due to this system, and letting m denote the number of flights in 10 million flight hours, the product mPave must be less than 1/100. The number of flights in 10 million flight hours is m = 107/Tf where Tf is the average flight duration [Note 3], so the requirement is (107/Tf)Pave < 10−2, which is equivalent to Pave/Tf < 10−9/FH. |
|
|
|
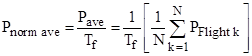
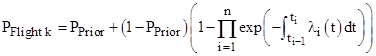
Accordingly, the Arsenal AC defines the “normalized” average probability (also called “Average Probability per Flight Hour”) of a hazard resulting from a given failure condition as |
|
|
|
|
|
|
|
where N is the number of flights in the life of a single airplane, Tf is the duration of each flight, and PFlight k is the probability of the hazard on the kth flight. The AC states that this quantitative value should be compared with the defined threshold for the given hazard level (e.g., 1E−09/FH for extremely improbable [Note 4] to determine compliance. |
|
|
|
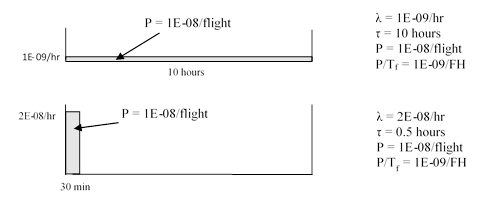
The calculation of PFlight k in the AC allows for the hazard rate function to be phase-dependent, so it could be zero in some phases, and even variable within a given phase, but the probability of a hazardous condition for a given flight depends only on the mean hazard rate during the flight, independent of how the hazard rate is distributed within the flight [Note 5]. This is illustrated in the figure below, which shows the results for two different systems installed on an airplane model with average flight duration of 10 hours. One system has a constant hazard rate of 1E−09/hr throughout the entire flight, and the other system has a hazard rate of 2E−08/hr during the first 30 minutes of each flight and zero during the remainder of the flight. |
|
|
|
|
|
|
|
Each system has exactly the same probability of catastrophic failure per flight, and consequently they both have probability 1/100 of a catastrophic failure during the benchmark 10 million flight hours. They are both assessed equally as having the normalized average probability of 1E-09/FH, just barely meeting the requirement for “extremely improbable”. |
|
|
|
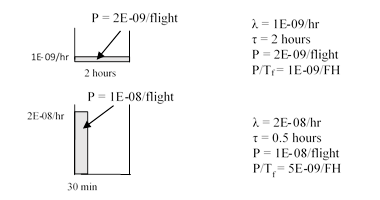
The figure below shows the same two systems installed on an airplane model with an average flight duration of 2 hours. In this case the systems have different probabilities per flight, because the first system’s hazard scales in proportion to the flight duration whereas the second system’s does not. |
|
|
|
|
|
|
|
The normalized average probability for the first system is again 1E-09/FH, just as for the airplane with 10-hour flights, consistent with the fact that the probability of a catastrophic failure during the benchmark 10 million flight hours is still 1/100. However, the normalized average probability for the second system on this airplane is 5E-09/FH, which is five times greater than the acceptable threshold, corresponding to the fact that the probability of a catastrophic failure condition in 10 million flight hours is 5/100. This is because the risk for this system isn’t proportional to the number of flight hours, it is proportional to the number of takeoffs, and this airplane has five times as many takeoffs during the benchmark 10 million flight hours than the airplane model with longer flights. |
|
|
|
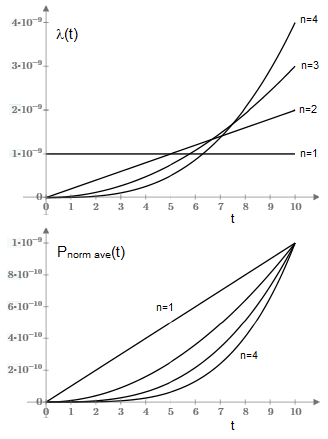
For hazards resulting from failures of multiple components in the same flight, the hazard rate varies during the flight, as showing in the figure below, but it remains true that the probability per flight is independent of how the hazard rate is distributed within the flight. It depends only on the integrated area under the curve. |
|
|
|
|
|
|
|
Here n represents the number of components in the minimal cutset, all assumed to be healthy at dispatch, and (for simplicity) all assumed to have the same individual failure rate. For the cases n=1,2,3,4 the individual component failure rates are 1.00E-10, 3.16E-06, 1.00E-04, and 5.62E-04 respectively. Although these four hazard rates functions are significantly different, the mean hazard rate on this 10-hour flight is the same for each of them, so they each give the same probability of failure per flight. This is just another illustration of why the probability per flight depends only on the mean hazard rate during the flight, not on how the hazard rate is distributed within a flight [Note 7]. |
|
|
|
Note 1: |
|
Guidance for quantitative risk calculations related to 14 CFR 25.1309 was originally provided in Advisory Circular 25.1309-1 issued by the FAA in 1982, and then in a revised version (-1A) issued in 1988. In both cases the guidance consisted of just two ambiguous sentences with no supporting rationale, leading to differing interpretations within industry and the regulatory agencies. In the 2000’s an Aviation Rulemaking Advisory Committee (ARAC) was formed to provide clear guidance, and this team (which included representatives from FAA, JAA/EASA, and experts from most companies in the aviation industry) developed and recommended another version of the AC, known as the “Arsenal” (arbitrarily named after a football club), with Appendix 3 containing detailed guidance for the quantitative risk criteria. This clarified guidance was formally adopted by the European Agency (now EASA), but not by the FAA. |
|
|
|
Note 2: |
|
The fundamental measure of risk for transport vehicles is the number of fatalities per passenger-mile. Since catastrophic airplane failures may result in loss of all passengers, the number of fatalities is assumed to equal the number of catastrophic accidents multiplied by the number of passengers per airplane. Also, the number of passenger-miles equals the number of airplane-miles multiplied by the number of passengers per airplane. So, the number of fatalities per passenger mile equals the number of catastrophic accidents per airplane-mile. Then, since large commercial transport aircraft all cruise at roughly the same speed (e.g., ~550 mph), airplane-miles are roughly proportional to airplane flight hours, and hence fatalities per passenger-mile is proportional to the probability of a catastrophic accident in a benchmark number of airplane flight hours, so this is a suitable measure for expressing a single quantitative requirement applicable to all large transport airplane models. |
|
|
|
Note 3: |
|
The AC says to assume the life of the airplane consists entirely of flights of average duration, so no account is taken of the effect of the actual distribution of flight lengths. To account for this, the usual expression would need to be multiplied by P(T)ave/P(Tave) for the given distribution of flight times. |
|
|
|
Note 4: |
|
Failure rates and normalized probabilities are both loosely expressed in terms of “per hour”, but they are quite different concepts. To avoid confusion and clearly distinguish between these quantities, it’s helpful to use the notation /hr for failure rates and /FH or normalized probabilities, but this convention is not universally followed. |
|
|
|
Note 5: |
|
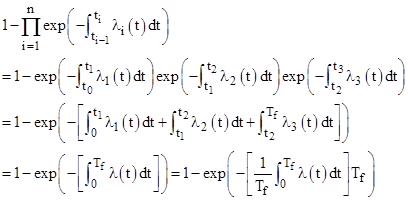
If the flight consists of n phases, and the ith phase extends from ti-1 to ti with a hazard rate function λi(t), the AC gives the probability of a given element being failed on the kth flight as |
|
|
|
|
|
|
|
If the element is checked and repaired before each flight, PPrior = 0. The last factor on the right hand side is the probability that the condition arises on the kth flight. For example if there are n=3 phases, this quantity is |
|
|
|
|
|
|
|
where t0 = 0 and tn = Tf., and λ(t) is the piecewise union of the individual λi(t) rate functions. Noting that the quantity in square brackets is just the mean hazard rate during the flight, the result is simply 1 – e-λTf where λ is understood to be the mean hazard rate. This shows that the result depends only on the integrated mean hazard rate during the flight, not on how it is distributed within the flight. Also, regardless of how the hazard rate is distributed within a flight, the Arsenal AC says to normalize the average of the resulting per-flight probabilities buy the average flight time, consistent with the fundamental objective of limiting the probability of a catastrophic condition in 10 million flight hours to 1/100. |
|
|
|
Note 6: |
|
The formula in Note 5 applies to failure conditions consisting of a single element, but it can be immediately generalized to Pk = eMTf Sk-1 Pk-1 for combinations of any number of elements, where S represent periodic repairs and M is the mean rate matrix. |
|
|
|
Note 7: |
|
As shown in Note 5, the risk for a given flight depends only on the mean hazard rate within the flight, but this has sometimes been confused with the issue of specific risk. The concern underlying specific risk requirements is that although the average risk for all flights may be low, it is possible that an unacceptable amount of risk might be concentrated in a small number of flights (i.e., specific dispatchable configurations). This depends on how the hazard rate is distributed between flights, but it has no bearing on the fact that the risk for a given flight is independent of how the hazard rate is distributed within that flight. |
|
|