|
Probability Calculations Using Microsoft Excel |
|
|
|
For reliability calculations it’s very convenient to use specialized software programs such as MathCad or MATLAB to carry out the iterative matrix operations. However, not everyone has access to such programs, so it’s desirable to be able to carry out these calculations using a more generic and widely-available software program such as Microsoft Excel. |
|
|
|
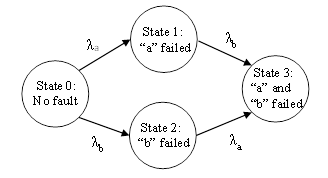
To illustrate with a simple example, consider a 4-state model representing the possible states of a 2-element system, as depicted below. |
|
|
|
|
|
|
|
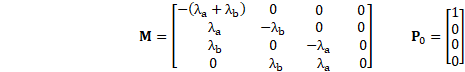
The failure rate matrix M for homogeneous evolution and the initial state vector are |
|
|
|
|
|
|
|
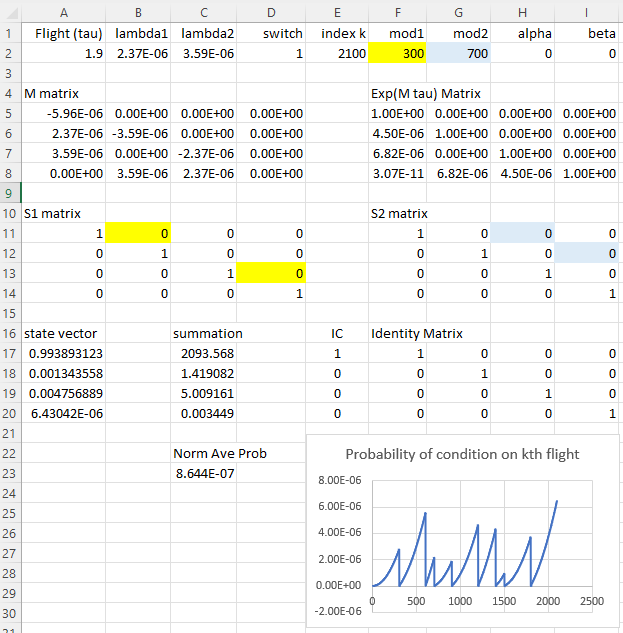
Suppose each flight duration is τ = 1.9 hours and the individual mean failure rates over an average flight profile are λa = 2.37E-06/hr and λb = 3.59E-06/hr, and suppose component “a” is checked/repaired every 300 flights, and component “b” is checked/repaired every 700 flights. The least common multiple of the inspection intervals is 2100 flights, after which the same cycle repeats, so it suffices to evaluate just 2100 flights. |
|
|
|
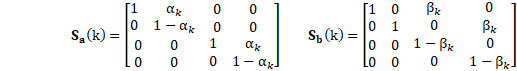
Every 300 flights the probability in state 1 is moved to state 0, and the probability in state 3 is moved to state 2. Likewise, every 700 flights, the probability in state 2 is moved to state 0, and the probability in state 3 is moved to state 1. This is accomplished by the repair transition matrices |
|
|
|
|
|
|
|
where αk = 1 iff mod(k,300)=0 and otherwise αk = 0, and similarly βk = 1 iff mod(k,700)=0 and otherwise βk = 0. The kth state vectors, representing the state probabilities at the end of the kth flight, are then given recursively by |
|
|
|
|
|
|
|
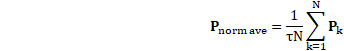
The normalized average probabilities of the states are then given by |
|
|
|
|
|
|
|
where N is the number of flights in the life of the airplane, or else in the least common multiple of the inspection/repair intervals (either of these will give the same answer), and τ is the average flight duration. |
|
|
|
Excel doesn’t have a built-in matrix exponential function, but we can either use the approach described in “Tiling Product of Matrices”, or more generally we can compute the matrix eMτ using the power series expansion |
|
|
|
|
|
|
|
|
|
|
|
The matrix multiplication function, MMULT, in Excel takes as inputs the labels of the upper left and lower right cells of each matrix to be multiplied. For example, if we have a 2x2 matrix in the cells A1, B1, A2, B2, then we designate this matrix by the diagonal corners as A1:B2, and we can multiply this with another 2x2 matrix at (say) C1:D2 by placing the expression “=MMULT(A1:B2,C1:D2)” into a cell such as F1. After typing this into F1, we press Cntrl-Shft+Enter. This should populate the product matrix into the cells designated by the diagonal corners F1:G2. |
|
|
|
Given an M matrix in A5:D8 and an identity matrix in F17:I20, the exponential matrix can be computed by |
|
|
|
=F17:I20+A2*MMULT(A5:D8,(F17:I20+(A2/2)*MMULT(A5:D8,(F17:I20+ |
|
(A2/3)*MMULT(A5:D8,F17:I20+(A2/4)*MMULT(A5:D8,F17:I20+ |
|
(A2/5)*MMULT(A5:D8,F17:I20+(A2/6)*MMULT(A5:D8,F17:I20)))))))) |
|
|
|
This computes the matrix exponential up to the 6th order term, so the largest neglected term is (Mτ)7/7!, which will be negligibly small provided the components of Mτ are all less than, say, 0.1. |
|
|
|
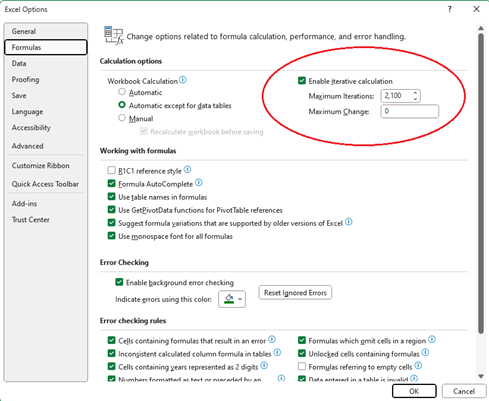
Now that we have the exponential matrix, the key to carrying out the actual probability calculation in Excel is to use the iteration capability. Go to File Options, Formulas, and check “Enable iterative calculations”, and then type N, the number of flights to be evaluated, into the “Maximum number of iterations” window. Also, type 0 into the “maximum change” window. See the screen cap of the window below. |
|
|
|
|
|
|
|
This set the global number of iterations option for all Excel files on this computer, so it will be applied to every Excel file unless/until the option is changed. As noted above, N may be the number of flights in the life of the airplane or the number of flights in the least common multiple of the inspection/repair intervals. Unfortunately, Excel doesn’t allow the number of iterations to be greater than 215 = 32768, whereas the number of flights in the life of an airplane may exceed this. For example, if the life of the airplane is 68400 hours, and the average flight duration is 1.9 hours, the number of flights in the life of the airplane is 36000, which exceeds the Excel limit. Fortunately, this isn’t a serious obstacle, because we can set the iteration limit to something like 6000, and then simply press the F9 key six times to achieve the 36000 iterations. On the other hand, in our example, we really only need to evaluate 2100 flights, which is the least common multiple of the inspection/repair intervals of 300 flights and 700 flights. |
|
|
|
To control the iterations, we place either 0 or 1 into cell D2, and we create an iteration index counter in cell E2 by defining it as “=IF(D2=0,0,E2+1)”. This is a circular definition, setting E2 equal to E2 plus 1, so it will iterate 2100 times. We then define mod1 and mod2 as the number of flights between inspection/repair of the two components with the failure rates lambda1 and lambda2 respectively. Using the mod values, we define variables alpha and beta to be used in the definitions of the repair transition matrices. We put |
|
|
|
H2=IF(MOD(E2-1,F2)=0,1,0) I2=IF(MOD(E2-1,G2)=0,1,0) |
|
|
|
We then use our “switch” (D2) to initialize the state vector and the summation vector (used to sum the state vectors). For example, in cell A17 we place |
|
|
|
=IF(D2=0,E17:E20,MMULT(MMULT(MMULT(F5:I8,A11:D14),F11:I14),A17:A20)) |
|
|
|
and in cell C23 we place “=IF($E$2=0,0,C17+A17)”. If we then set the “switch” cell to 1, the spreadsheet will iterate 2100 times, and the normalized average probability in C23 of the top event is found by dividing the contents of C20 by N (in E2) and τ (in A2). |
|
|
|
To plot the probabilities of the failure condition for each flight, or every 10th flight, we create a column of indices starting in (say) cell B33 from 1 to 2100 (at any convenient interval), and then fill the adjacent C column by setting C33 to “=IF(B33=$E$2,$A$20,C33)”, and fill down to complete the column. When the spread sheet is executed, this column of cells will be populated. The iteration index triggers each data point save, which can then be plotted. |
|
|
|
This is shown in the screen cap below. |
|
|
|
|
|
|
|
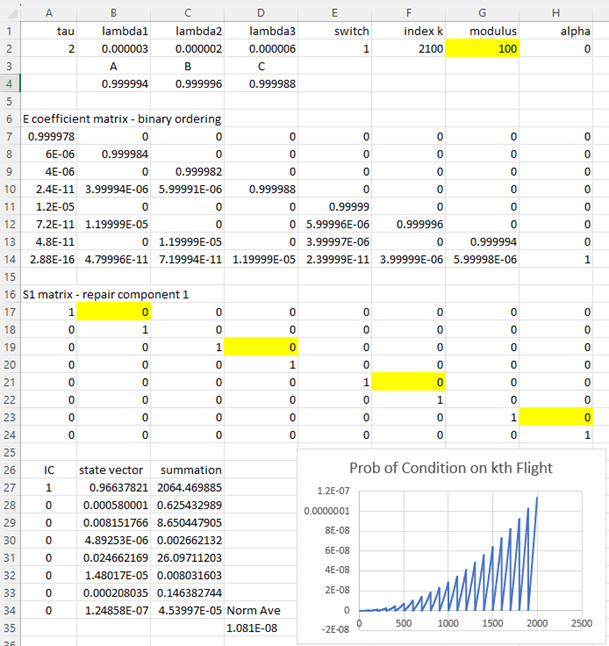
The same method can be used to create an excel file to evaluate the probabilities of any other Markov model. For example, a canonical model for a three-element cutset involves 8x8 matrices, as shown in the example below. |
|
|
|
|
|
|
|
In this case, rather than computing the exponential matrix from the rate matrix, we’ve made use of the tiling pattern to express the components of the exponential matrix directly in terms of the exponentials (denoted by A, B, C) of the individual failure rates. Also, in this example we have just a single check interval, that inspects and repairs component #1 every 100 hours. |
|
|